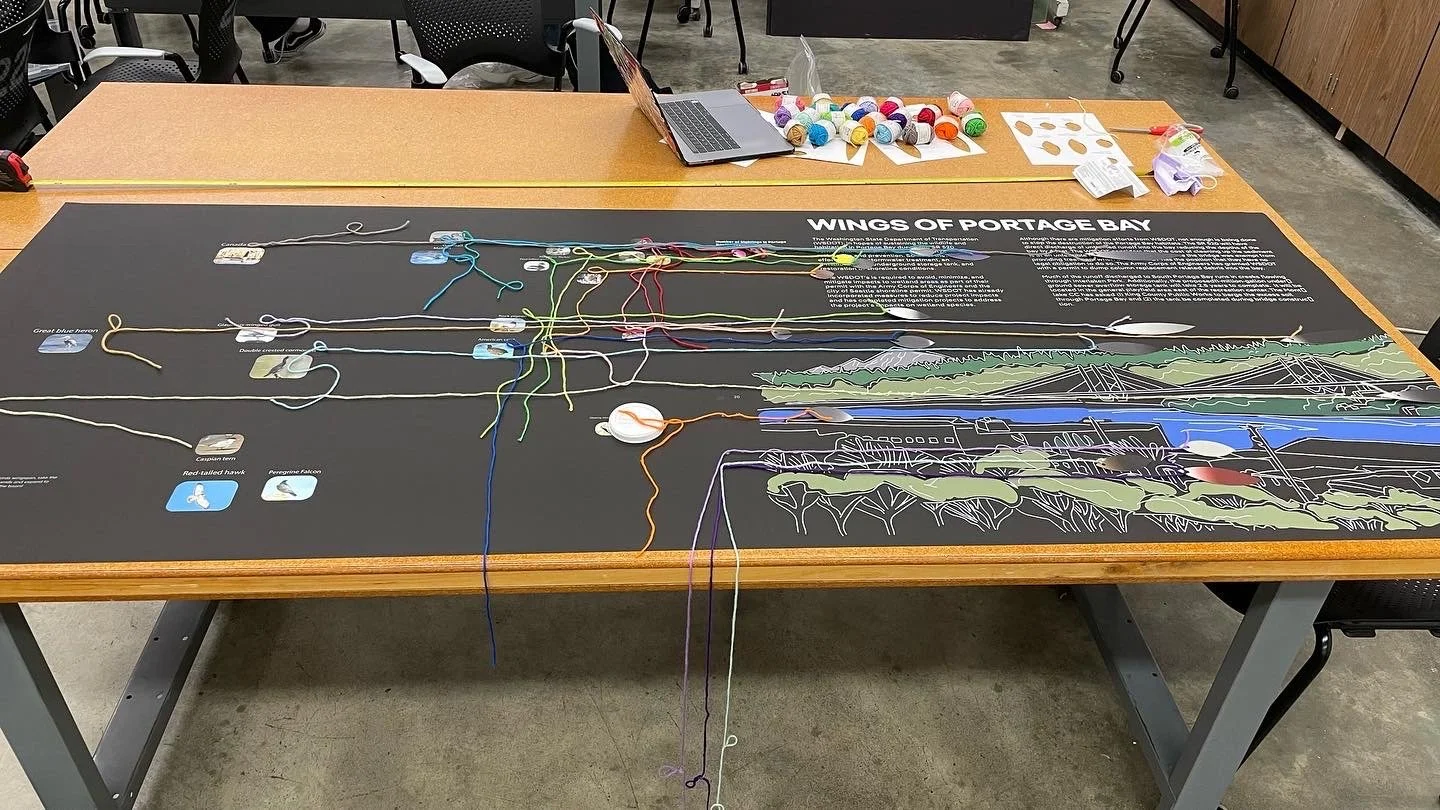
How can we get viewers to interact and approximate the sizes of birds while also informing them of their actual sizes?
How can we view the sizes of birds sighted by the Portage Bay bird watchers, while integrating it with physical spaces and objects?
PROCESS
Duration: 4 Weeks
Project: Data Installation
Type: Solo
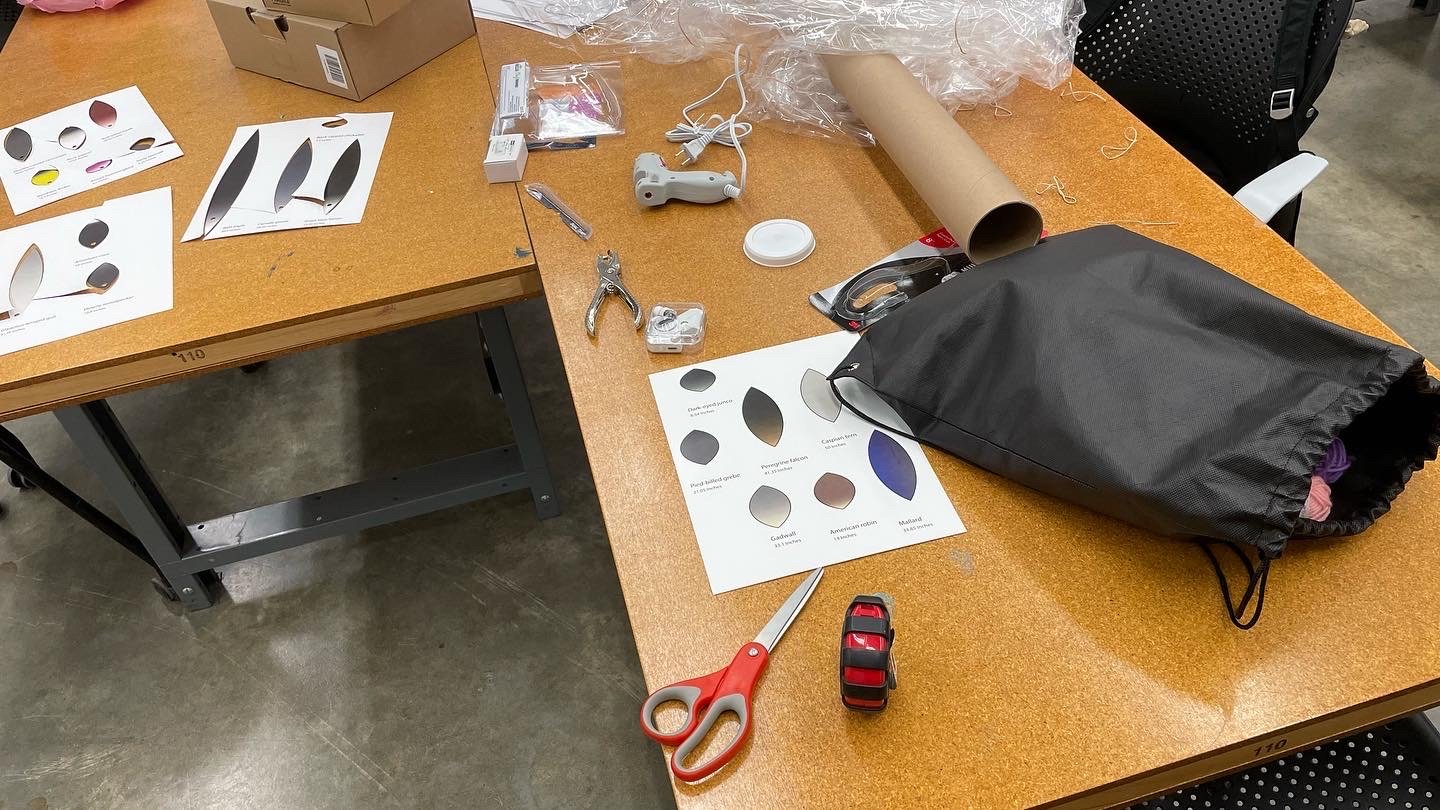
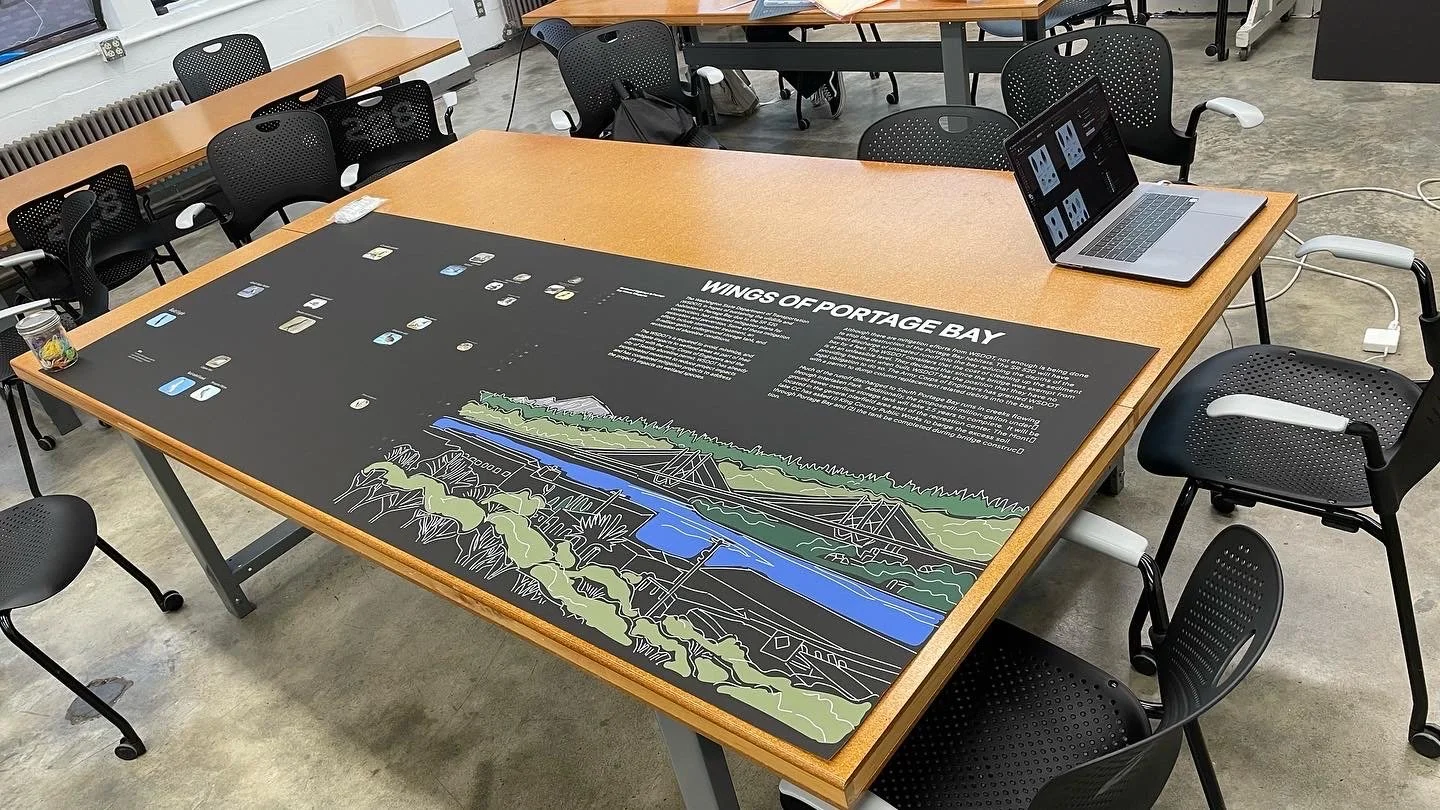
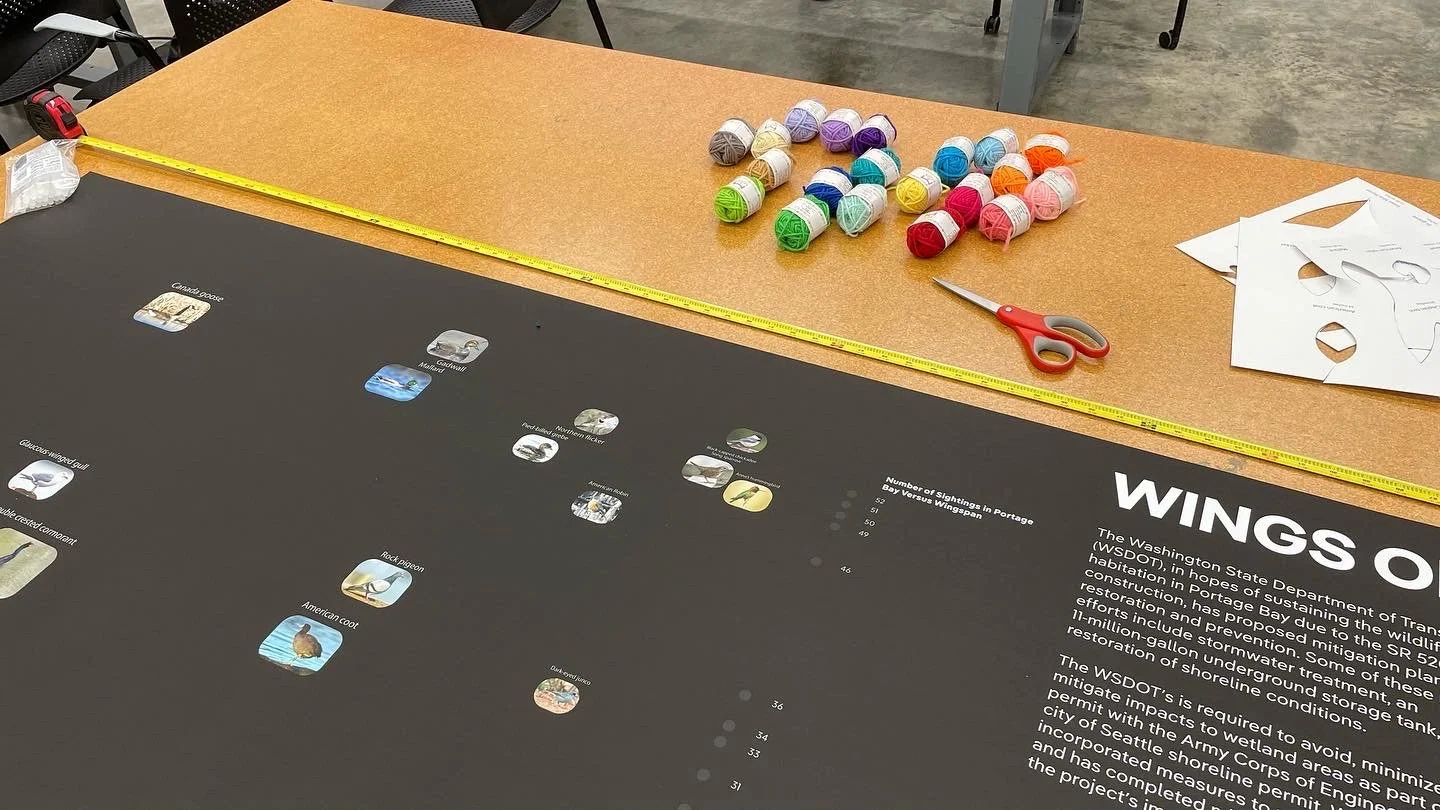
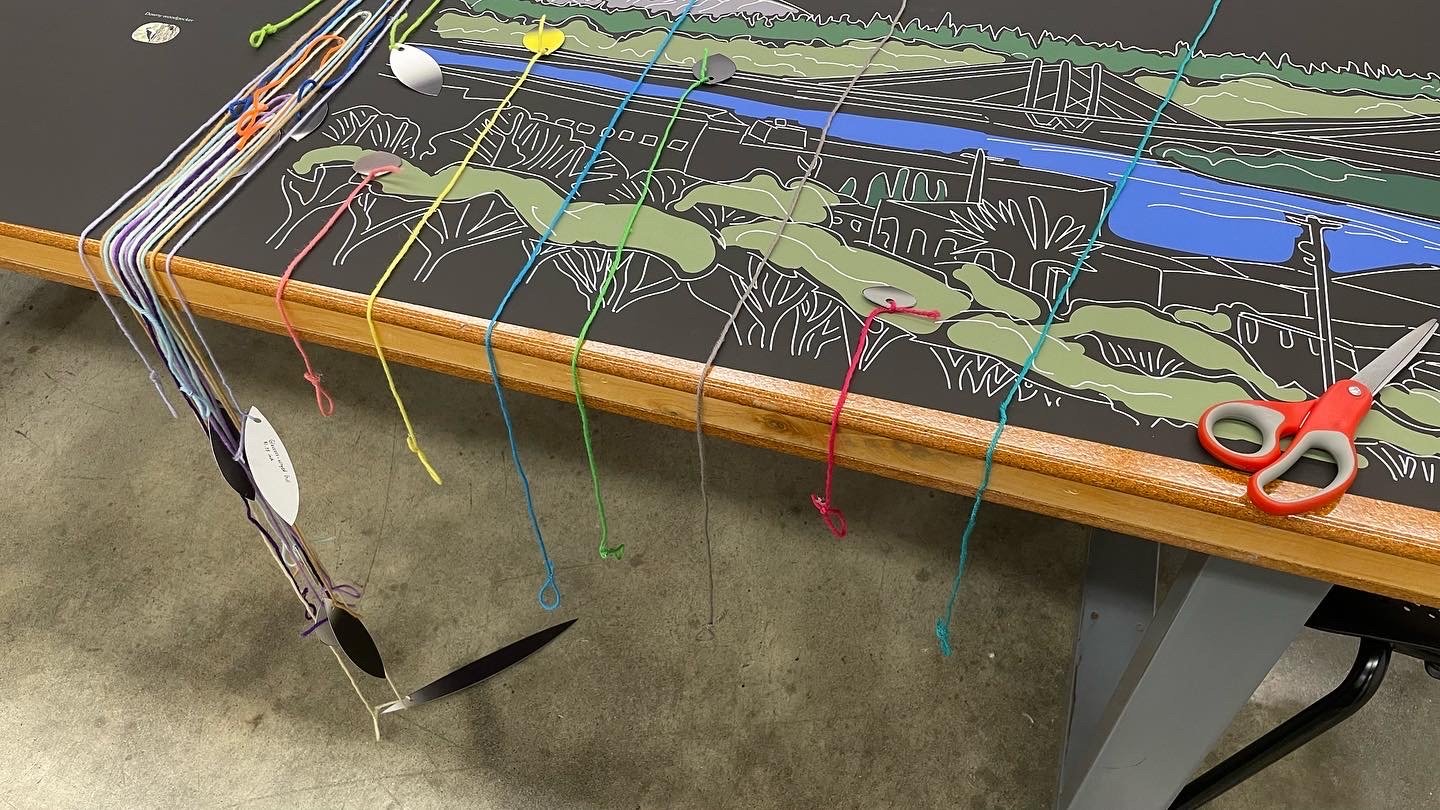
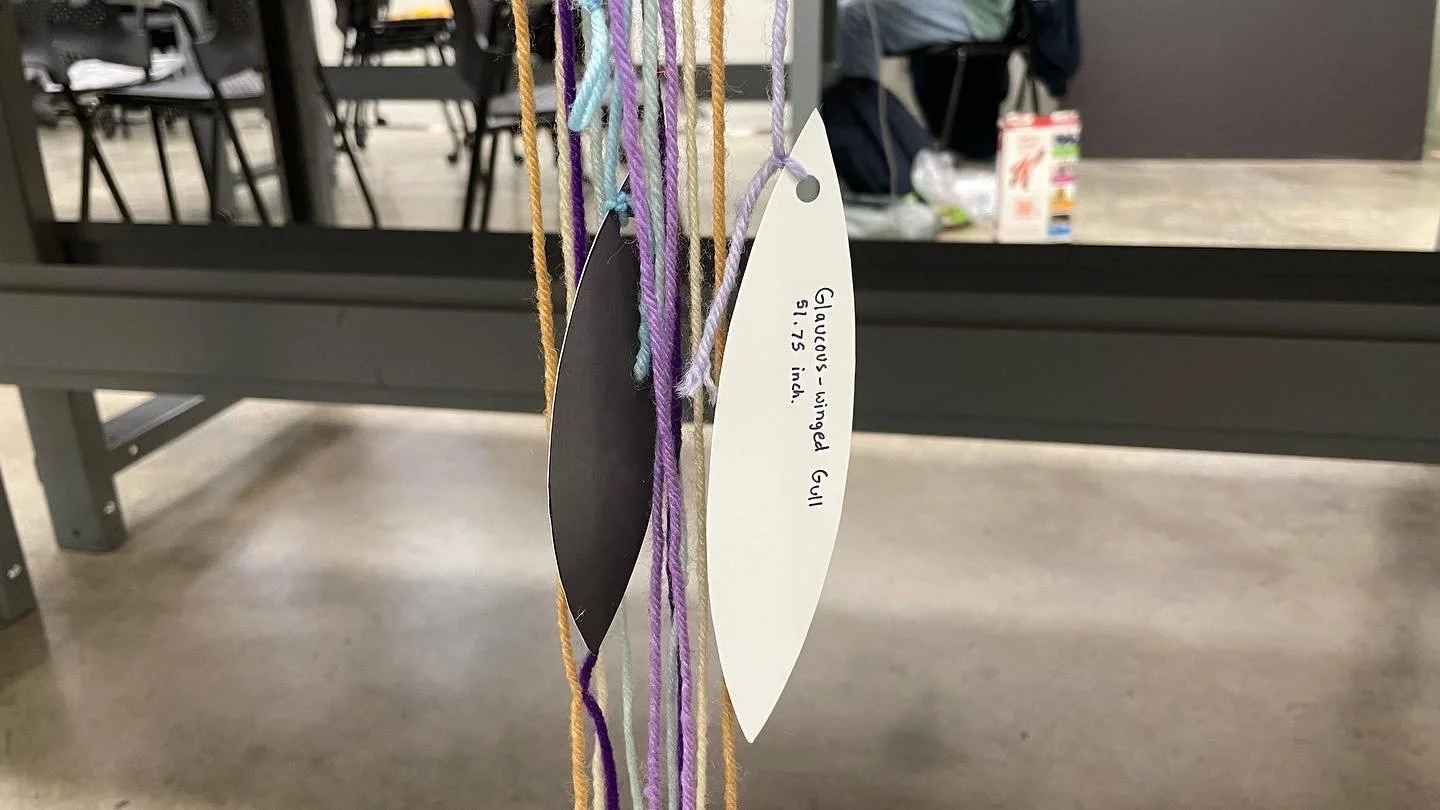
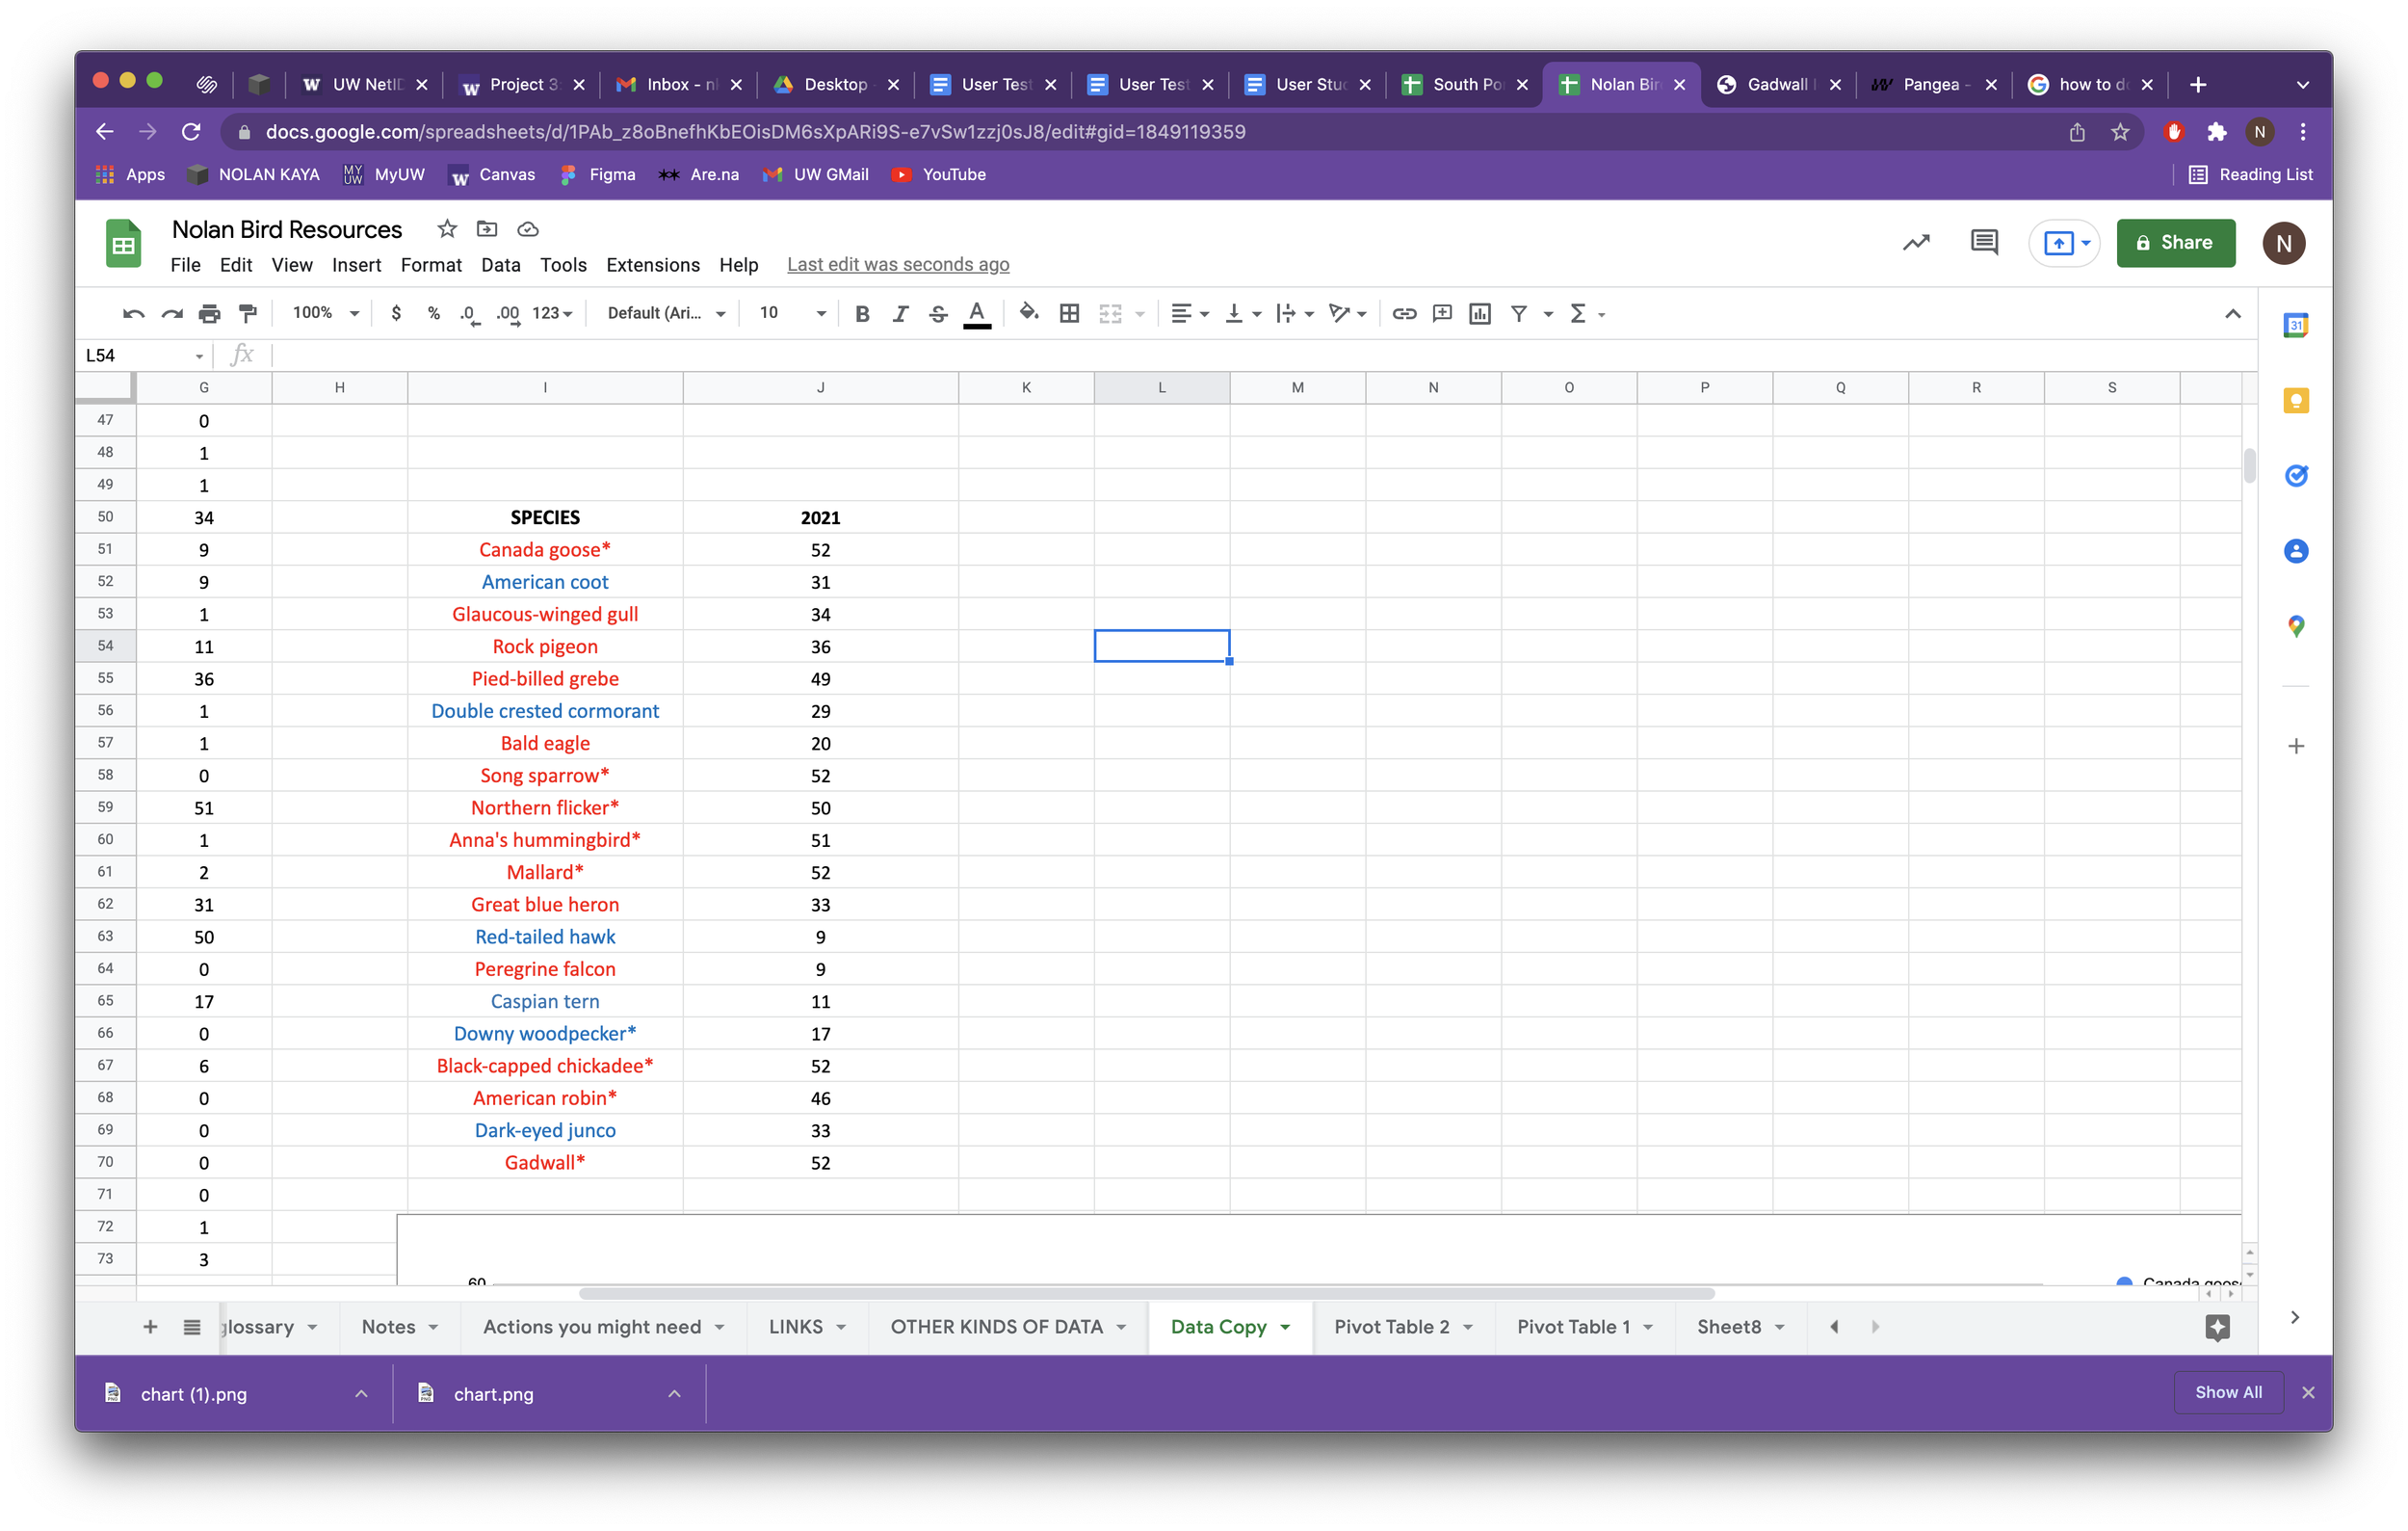
My visualization started out with me compiling data from the Portage Bay bird watchers of 10 different birds from various orders. I eventually included 10 more birds to my data set. After viewing the sizes of the birds, I decided to move in the direction of visualizing wingspans and number of sightings in the year 2021. My takeaway was that a lot of people see birds daily, but they are usually spotted from afar. My idea was to not only inform on the rarity of the birds through their sightings, but to also show the viewers how big these birds are up close. I was able to achieve this through my use of yarn to represent the wingspans as well as the height of the yarn to represent the rarity. Each piece of yarn is cut to the average length of an adult species while the height to which each bird is located represents the number of times spotted in Portage Bay during the year 2021.
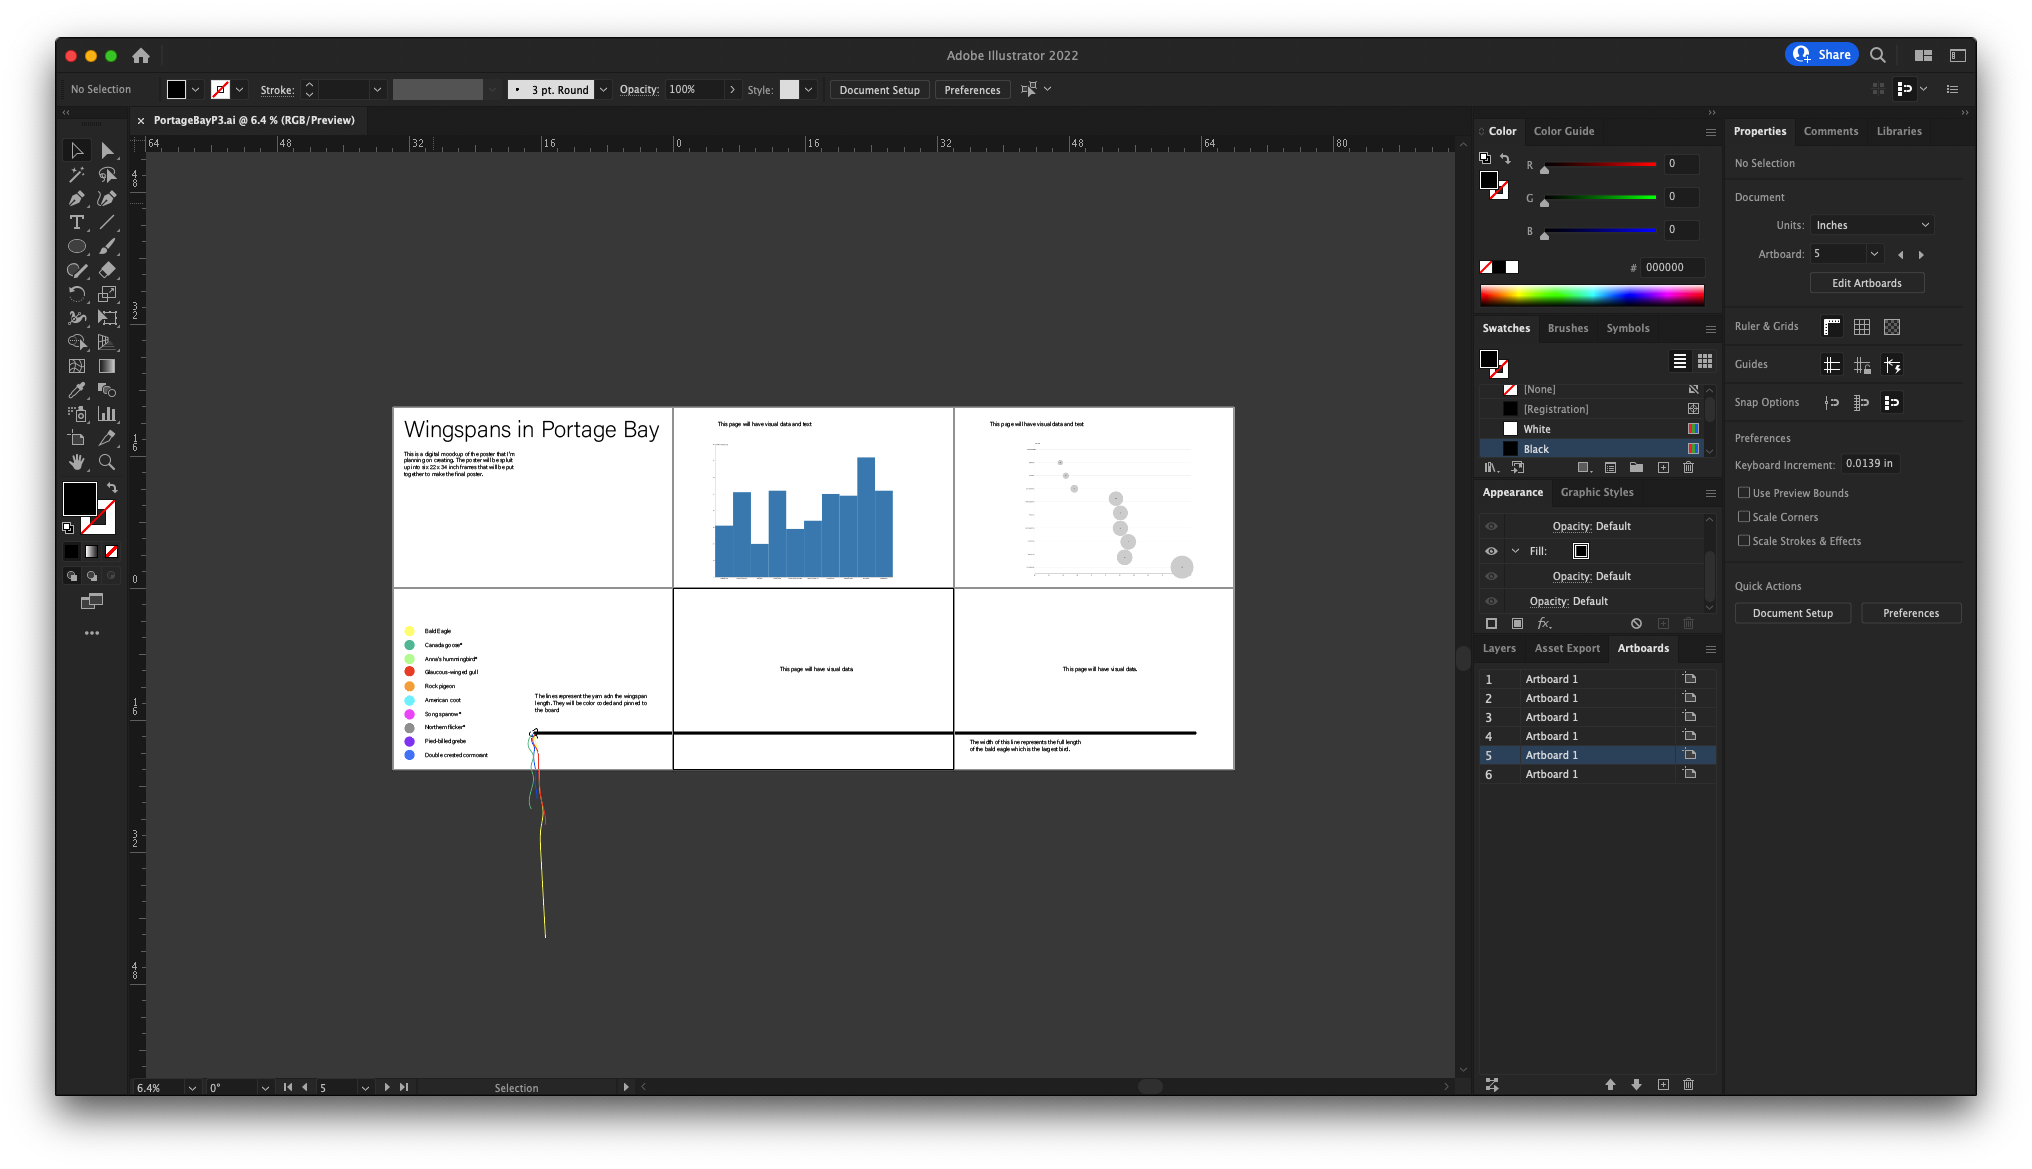
Process Flow
Data Set
First iteration
Vertical Scatter Plot
Second iteration


